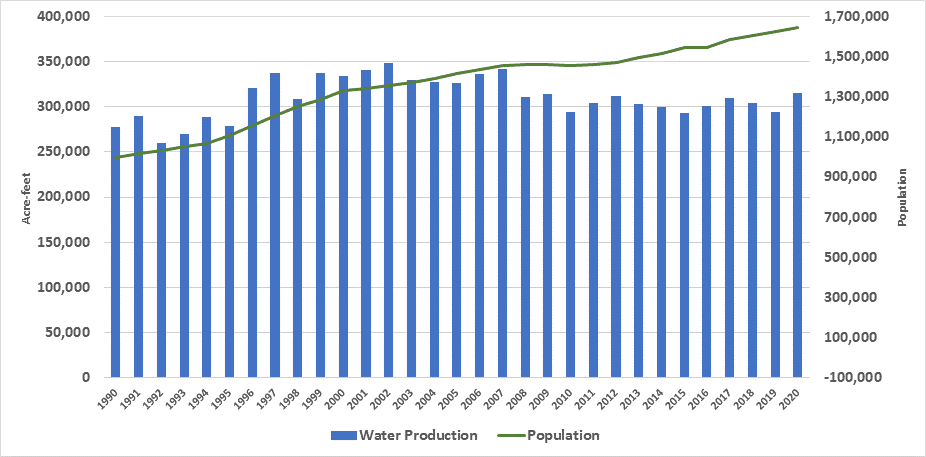
Since the nineties, the population of Phoenix has grown steadily, from about one million in 1990 to more than 1.5 million today. Although the growth in water use more or less kept pace with the growth of the city in the nineties, total water use has actually declined in recent years, thanks in part to effective water conservation by homes and businesses. The chart to the left shows the population and water use of Phoenix for 1990-2020.
Historical Population and Water Use
Growing Population, Changing Demand

Growing population


Changing Demand
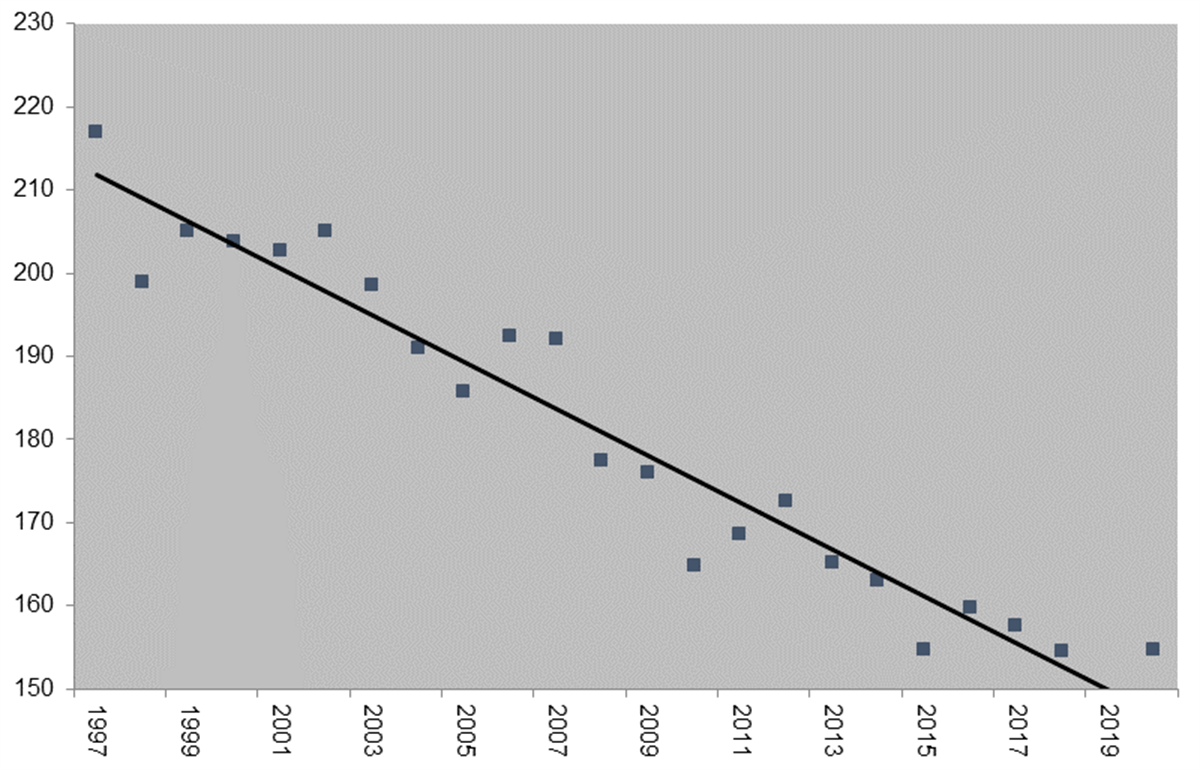
As Phoenix residents and businesses have become more water-efficient, per capita use has declined. The chart to the left is a scatter plot showing the declining trend in water use per person. The declining trend has been quite widespread and has occurred across a broad range of homes and businesses. In 2019, the average Phoenix resident used about 29 percent less water than the average resident in 1990.

Learn more - 2021 Water Resource Plan